
Two Shopify stores can make the same revenue in a month and still be in very different shape. One might be getting there with hundreds of small orders and a big ad bill.
The other might be getting there with fewer customers who each spend more. The number that shows this difference is your average order value.
I check AOV before I suggest any change to a Shopify store, because it shows me what a customer is worth the moment they decide to buy.
So before we talk about what a healthy number looks like, let us get the calculation right.
What Is AOV and Why It Matters for a Shopify Store
AOV, or average order value, is the average amount a customer spends in one order on your Shopify store.
AOV is measured per order, not per customer, so a shopper who buys twice in a month counts as two orders. We should read AOV first because it connects directly to how much a Shopify store can afford to spend on marketing.
Every new customer costs money to bring in. Ads, influencer posts, content and first order discounts all add up before a single product ships.
When each order brings in a small amount, the acquisition cost eats most of the profit. When each order is larger, the same marketing spend leaves more behind.
AOV also tells you how people shop on your Shopify store. A low AOV usually means most customers buy one item and leave.
A higher AOV means customers add a second product, pick a bigger pack or choose the premium version. Neither pattern is good or bad on its own, but knowing which one you have tells you where to put your effort.
The AOV Formula
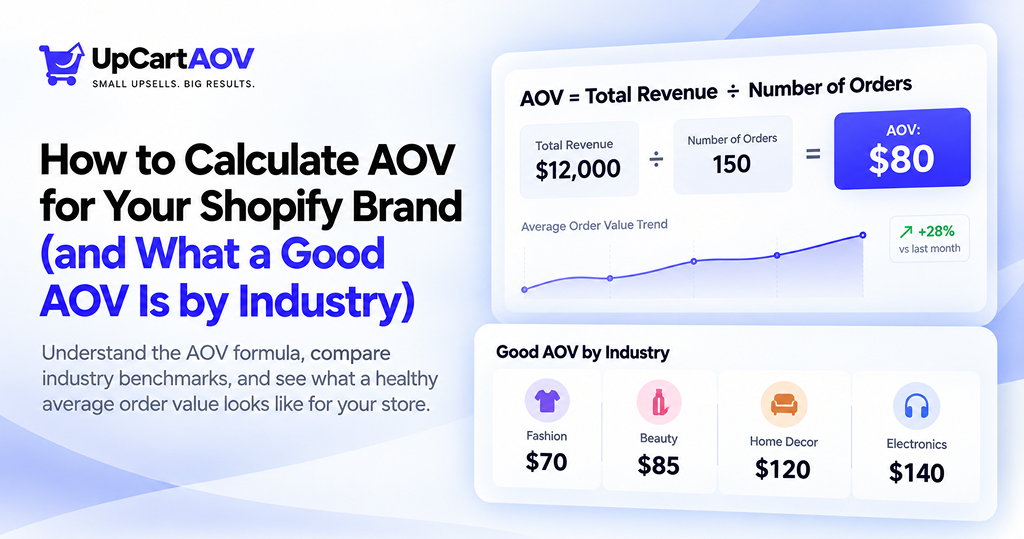
The average order value formula divides the revenue your Shopify store earned in a period by the number of orders placed in that same period.
Where I see AOV go wrong is in the inputs, such as revenue that includes shipping and taxes, or an order count that still has cancelled orders in it. Here is the formula, along with the steps I follow to make sure both numbers are right:
AOV = Total Revenue ÷ Number of Orders
The AOV formula divides the revenue earned in a set period by the number of orders placed in that same period. The result is what one order is worth on average. Here is how I calculate it step by step:
- Pick a date range, ideally one full calendar month.
- Add up revenue for that range, using product sales after discounts and leaving out shipping and taxes.
- Count the orders placed in the same range, leaving out cancelled and fully refunded orders.
- Divide revenue by the number of orders.
A Simple Example:
Say you run a Shopify store that sells handmade candles. In September, the Shopify store earned $18,000 from 300 orders. Dividing $18,000 by 300 gives an AOV of $60, which means the average customer who checked out spent $60.
Now say you add a small candle care kit as a cart add on. In October, the same 300 orders bring in $21,000. The candle Shopify store’s AOV rises to $70, and the business earns $3,000 more without a single extra visitor. I like testing changes like this first, because traffic is the expensive part of running a Shopify store.
Why Both Numbers Must Follow the Same Rules
Revenue and order count must come from the exact same date range and use the same definition of revenue. If September revenue includes shipping and taxes and October revenue does not, AOV will drop on paper even when customers bought in exactly the same way. Before comparing months, I decide which revenue figure to use, usually product sales after discounts without shipping and taxes, and stick to that same figure every month. With one fixed definition, any rise or fall in AOV comes from customer behavior and not from a change in how the number was measured.
What Is a Good AOV? Benchmarks by Industry
A good AOV is different for every industry. What a product costs, how often people need it and whether they buy it for themselves or as a gift all affect how much they spend in one order. So compare your Shopify store only with brands that sell similar products.
A simple check also helps. Take your AOV and subtract product cost, shipping and payment fees. If what is left is more than what you spend to get one customer, your AOV is healthy
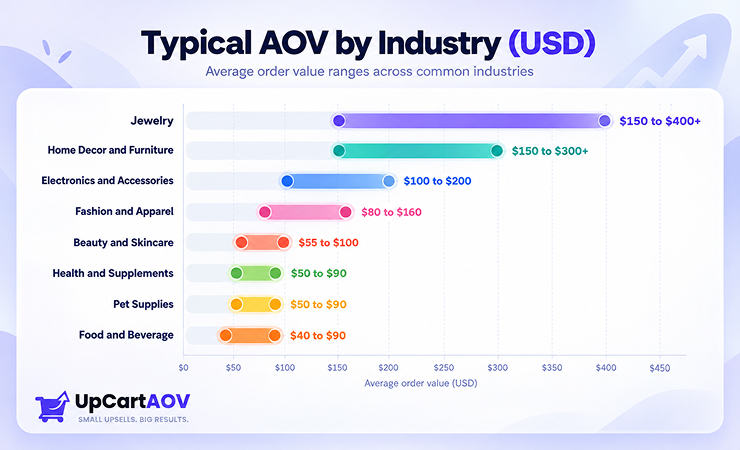
The table lists typical AOV ranges for common ecommerce categories, in US dollars, based on what I see across the Shopify brands I work with. A Shopify store’s own AOV can sit above or below its range depending on price point, region and the offers it runs. Find your category in the table and check where your current AOV falls:
| Industry | Typical AOV range (USD) | Main reason for the range |
| Fashion and apparel | $80 to $160 | Frequent but careful buying |
| Beauty and skincare | $55 to $100 | Repeat purchases, trial before commitment |
| Health and supplements | $50 to $90 | Customers buy a few weeks’ supply |
| Home decor and furniture | $150 to $300, higher for large furniture | Rare, long lasting purchases |
| Electronics and accessories | $100 to $200 | High unit price, one device per order |
| Jewelry | $150 to $400, higher for fine jewelry | Material cost and gifting |
| Baby and kids products | No fixed range | Mix of daily needs and big gear |
| Pet supplies | $50 to $90 | Routine repeat buying |
| Food and beverage | $40 to $90 | Low price, short shelf life |
Fashion and Apparel: $80 to $160
When a fashion brand asks me to look at its AOV, the first thing I check is how much of each order actually stays sold. People buy clothes often, but not every week, and they like to try a new style without spending too much on one order.
Clothing also has more size swaps and returns than most categories, so the number on the dashboard can look better than the money that stays in the business. Here is what lifts fashion AOV and where brands usually slip:
- What lifts AOV: “Complete the look” suggestions, like a belt with trousers or socks with shoes, work better than showing another similar top.
- Watch out for: Size exchanges and returns. Shopify’s AOV card counts the original order value even when part of the order comes back, so a fashion brand’s real AOV is often lower than the card shows.
Beauty and Skincare: $55 to $100
Skincare is the category where I see brands worry most about small orders, even when their customers keep coming back. Beauty customers know a refill is a few clicks away, so they rarely stock up, and many test one product before trusting a brand with a full routine.
Trust builds one product at a time, which keeps each order small even when yearly spend is high. These are the two things I look at for any skincare brand:
- What lifts AOV: Bundles of products used together in one routine, like a cleanser, serum and moisturizer. A routine bundle works because the customer already knows they need a product for each step, and buying the set together feels easier than picking products one by one.
- Watch out for: Judging a beauty customer on one order. A shopper who reorders every month can be worth far more than the AOV suggests.
If you want to increase AOV for your skincare Shopify store, read Skincare & Beauty Shopify Stores: Bundle Upsells That Don’t Feel Pushy to see how the right bundles can make each order bigger.
Health and Supplements: $50 to $90
With supplement brands, I always remind myself that the first order is a trial, not a commitment. Most customers buy only a few weeks’ supply because they want to see whether the supplement suits their body before buying more.
A customer is putting something into their body, so caution on the first purchase is natural and not a sign of a weak offer. Keep these points in mind before you plan any supplement offer:
- What lifts AOV: Multi month packs and subscriptions, offered once the customer has finished the first bottle.
- Watch out for: Pushing large packs on first time buyers. Asking someone to commit to three months of a product they have never tried usually lowers conversion.
Home Decor and Furniture: $150 to $300, and more for big furniture
Home decor is one of the few categories where I tell Shopify store owners to slow the upsell down rather than speed it up. People buy these products rarely and keep them for years, so they are ready to spend more per purchase, but they also take longer to decide.
A shopper buying a sofa or a dining table is making a choice they will live with, and a rushed add on can feel out of place. Here is how that plays out for home decor and furniture brands.
- What lifts AOV: Items that complete the room, like a rug, a side table or a floor lamp shown next to a sofa. Furniture shoppers usually picture the whole space while buying, so suggesting pieces that match the style and size of the main item feels helpful instead of pushy.
- Watch out for: Comparing yourself with the full range. A Shopify store selling cushion covers and one selling dining tables are in the same category but will never have similar AOVs.
To see why upsells for this category need a different approach, read my guide on Furniture/Home Decor Upsells: Why “Frequently Bought Together” Works Differently.
Electronics and Accessories: $100 to $200
In electronics, I pay more attention to the small items in the cart than to the device itself. Devices carry a high unit price, which pushes AOV up, but most customers buy only one main device per order, which stops it from climbing further.
The accessories around that device often decide how much the order is really worth. The points that matter most for an electronics brand are these:
- What lifts AOV: Accessories the buyer needs anyway, like a case, screen protector or charger.
- Watch out for: Low margins on the main device. A small accessory often earns more profit than the device itself, so track profit per order and not only AOV.
Jewelry: $150 to $400, and more for fine jewelry
Jewelry brands usually have a healthy AOV already, so my focus with them shifts to what a customer might want alongside the piece they picked. Precious metals and stones set a high base price, and jewelry is often bought for birthdays, weddings and anniversaries, when people are ready to spend more.
Because the purchase is tied to a person or an occasion, the add on has to feel just as personal. Here is what I would focus on for a jewelry brand:
- What lifts AOV: Matching pieces, like earrings for a pendant or a bracelet from the same collection. A shopper buying a gift often wants it to feel complete, so showing a matching piece in the cart gives them an easy way to turn one item into a set.
- Watch out for: Seasonal spikes. Valentine’s Day and wedding season orders can make a normal month look weak in comparison, so compare those periods with the same season last year instead.
If you run a jewelry brand and want bigger orders, jewelry cart upsells that offer matching pieces are one of the easiest ways to get there.
Baby and Kids Products: No fixed range
I never give baby brands a benchmark number, because two Shopify stores in this category can sell completely different things. The category mixes small daily needs like diapers and wipes with large one time purchases like strollers and cribs.
One brand might sell products parents reorder every week, while another sells gear a family buys once. So instead of a number, here is how I would read AOV for a baby brand:
- What lifts AOV: For daily items, bulk packs and refill bundles. For big gear, related accessories like a stroller organizer or car seat cover.
- Watch out for: Comparing with the wrong brands. A baby brand should compare only with brands selling a similar product mix.
Pet Supplies: $50 to $90
Pet owners are some of the most predictable shoppers I see, and that routine shapes every order they place. They come back for the same food, treats and litter again and again, so each order does not need to be large.
They know what their pet eats, how long a bag lasts and when they need to reorder. Here is what that routine means for AOV in a pet brand:
- What lifts AOV: Suggesting a paid add on like a treat, chew toy or grooming item with the regular food order, or offering a larger bag of food at a better price per kilo. Pet owners already know they will need more food soon, so a bigger bag with clear savings feels like a smart buy instead of extra spending.
- Watch out for: Free shipping on heavy products like food and litter. Courier charges for heavy orders are high, so if a customer adds one more bag just to get free shipping, the brand may end up paying more for delivery than it earns from that extra bag. Set the threshold based on your real shipping cost per order, not only on your AOV.
Food and Beverage: $40 to $90
Food is the category where I look at shipping cost before I look at AOV, because the two are closely linked. Food products are low priced, get used up quickly and often have a short shelf life, so customers buy only what they need for the next few days or weeks.
With orders this small, even a modest delivery charge takes a big share of what the customer pays, and many shoppers drop off at checkout when they see it. So for any food brand, I start with two things:
- What lifts AOV: Gift boxes during festive seasons and variety packs that bring several flavours or products together in one order. A variety pack works well because food shoppers like to try new flavours but hesitate to buy a full pack of something they have never tasted. A gift box works for a similar reason, since customers buying for family or friends usually spend more than they would on themselves.
- Watch out for: Shipping cost compared with order size. A $10 delivery charge on a $40 order is a quarter of the basket, which feels expensive to the customer even if the food itself is fairly priced. Setting a free shipping threshold a little above your current AOV gives customers a reason to add one more item instead of leaving the cart, but check that your margin on that extra item still covers the delivery cost you take on.
Why Your AOV May Differ From Industry Averages
When a Shopify store’s AOV sits below its industry range, the usual first reaction is to assume something is broken. A gap from the average almost always has a clear reason behind it, and finding that reason is more useful than chasing the benchmark.
A Shopify store sitting above the range can also be hiding a problem, such as heavy returns or a single large wholesale order lifting the average. Before deciding whether the gap needs fixing, I check four things:
- Price point and product range: Price sets the floor and ceiling for AOV. A Shopify store whose best seller costs $15 will naturally have a lower AOV than a brand whose best seller costs $120, even if both are doing well. In this case, compare your AOV with your own past months instead of the industry, because steady growth month over month shows your offers and product pages are working.
Bookstores are a good example, since low-priced books keep AOV small unless the Shopify store uses the right bookstore upsell strategies. - Target audience and region: Spending habits change with who you sell to and where. A brand selling mainly to college students will see smaller orders than one selling to working professionals, and the same product line can show a different AOV in different countries. If you sell in more than one market, check AOV for each market separately before comparing it with any benchmark.
- Device your customers shop on: Shoppers on a phone during a short break tend to place quick, small orders, while shoppers on a laptop often browse longer and add more to the cart. A Shopify store with mostly mobile traffic should give its mobile cart and product pages the most attention, since a cramped cart drawer or hard to tap add on buttons can keep orders small.
- Discount and shipping policies: When two Shopify stores in the same category have very different AOVs, discount and shipping rules are often where I find the reason. Frequent sitewide discounts lower what customers pay per order, and a free shipping threshold changes how much they add before checkout. A threshold set slightly above your current AOV pushes people to add one more item, while one set far above it simply gets ignored.
How Do You Check AOV in Shopify Analytics?
Shopify calculates AOV automatically, and I open the Average order value card on the Analytics page before almost any other number when I review a Shopify store.
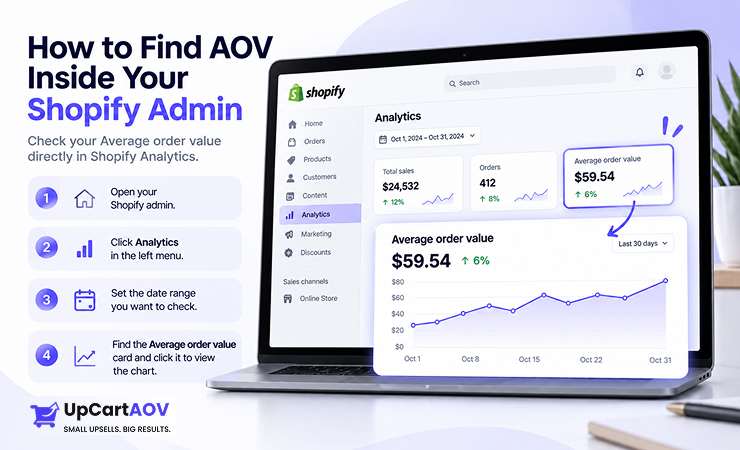
The card saves you from doing the maths by hand every month, but the figure is only as useful as your understanding of what goes into it. Here is how to find it in a few clicks:
- Open your Shopify admin.
- Click Analytics in the left menu.
- Set the date range you want to check at the top of the page.
- Find the card named Average order value and click it to see a chart of how the number has moved across that period.
Shopify works out this figure by taking gross sales, subtracting the discounts customers used and dividing the result by the number of orders. Shipping and taxes are not part of gross sales, so they do not inflate the number. Before you make decisions based on the card, keep these two points in mind.
- Returns are not taken out: Returns, exchanges and order edits made after checkout do not change the figure on the card. If a customer sends back half of an order, Shopify still counts that order at its full original value. For a Shopify store with a high return rate, such as a fashion brand handling size swaps, the real AOV can be noticeably lower than what the card shows, so I compare it with net sales from the sales reports under Analytics before trusting it.
- The date range changes the story: One week can look very different from a full quarter, especially if the week includes a sale or one unusually large order. I look at a full calendar month first and compare it with the same month last year, because comparing a quiet week with a festive one says nothing about real progress.
Gross Sales vs Net Sales: Which Number Should You Use for AOV?
Net sales gives a more accurate AOV than gross sales for most Shopify stores. Gross sales is the total value of products sold before discounts, returns and refunds are taken out. Net sales is what remains after those deductions, which makes it much closer to the money a Shopify store actually keeps.
| Gross sales | Net sales | |
| What it includes | Full product value of every order | Product value after discounts, returns and refunds |
| What it tells you | How much customers wanted to buy | How much money stayed with the business |
| Effect on AOV | Shows a higher AOV | Shows a lower but truer AOV |
| Best used for | Reading demand and sale performance | Profit checks, ad budgets and shipping thresholds |
Common Mistakes When Calculating AOV
The most common AOV mistake I see is not a maths error. Shopify store owners divide correctly but feed the formula numbers that include money they never kept, or orders that do not reflect normal shoppers.
Knowing how to calculate AOV is only useful when the inputs are clean, and these are the four mistakes that most often make the number misleading:
- Counting Refunds and Cancelled Orders: If an order is cancelled or fully refunded, that money never stayed with you. Leaving it in your revenue inflates your AOV. Remove these orders, or use net sales so they are already accounted for.
- Mixing Shipping and Taxes Into Revenue: Shipping fees and taxes are not what customers paid for your products. Taxes go to the government, and shipping usually covers a courier cost. If you add them into revenue, your AOV will look higher than what your products are really earning. Keep them out.
- Letting a Few Large Orders Skew the Average: One wholesale order of $5,000 can lift your monthly AOV in a way that has nothing to do with normal shoppers. If you get bulk or B2B orders now and then, look at your AOV with and without them. The version without them shows how your regular customers behave.
- Comparing AOV Across Very Different Seasons: A gifting season and a slow month are not equal. People buy more during festivals and big sale events, and they buy gifts for several people at once. Comparing that period with a quiet one will give you a false story. Compare similar periods instead.
AOV vs Other Key Ecommerce Metrics
AOV is a useful number, but on its own it only shows one side of your Shopify store. A high AOV can look great until you notice that fewer people are buying, or that each new customer costs more than they spend.
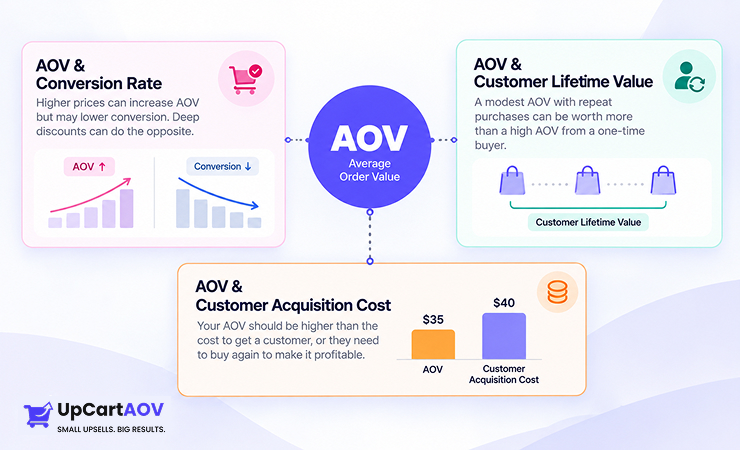
To understand whether your Shopify store is truly doing well, you need to read AOV together with a few other metrics:
- AOV and Conversion Rate: These two often pull in opposite directions. If you raise prices, AOV may go up while fewer people buy. If you offer deep discounts, more people may buy while AOV drops. Your goal is to grow AOV without hurting conversion, so always check both together.
- AOV and Customer Lifetime Value: Lifetime value is how much a customer spends with you across all their orders. A customer with a modest AOV who buys every month can be worth more than someone who spends a lot once and never returns. AOV looks at one order. Lifetime value looks at the whole relationship.
- AOV and Customer Acquisition Cost: This is the comparison I check first with any brand. If it costs you $40 to get a customer and your AOV is $35, you are losing money on the first order. Either your AOV needs to go up, or that customer needs to come back and buy again.
How to Increase AOV on Your Shopify Store
Once you know where your AOV stands, the next step is to grow it. Over my years of experience with Shopify brands, a few methods have worked again and again:
- Product bundles: Group products that are used together into one pack and sell it at a lower price than buying each item separately. This gives customers a reason to buy the full set instead of just one item.
- Cart drawer and product page upsells: Show a related add on at the moment a customer is ready to buy. If you want these suggestions to match each shopper’s cart automatically, these AI-powered recommendation apps can help you choose the right Shopify app.
- Free shipping thresholds: Set the limit a little above your current AOV so people add one more item. Pairing it with a cart progress bar works even better, as I have explained in how a free shipping progress bar increases cart value.
- Product Volume discounts: Give customers a bigger discount as they buy more of the same product. For example, they get a small discount on 1 unit, a bigger discount on 3 units and the biggest discount on 6 units. Seeing the savings grow encourages them to pick a larger pack, which helps increase AOV.
- Post purchase offers: Offer a quick one click add on right after checkout.
I have explained each of these in detail, with practical tips, in my guide on how to increase average order value on your Shopify store.
How Often Should You Track AOV?
I check AOV once a week to catch sudden changes and review it properly once a month. A weekly look is quick and only needs the Analytics card, while a monthly review takes a little more time and gives the real trend. Each type of check answers a different question, so here is what I look for in each one:
- Weekly check: Open the Average order value card and compare it with the previous week. A sudden drop often points to something broken, like a bundle that stopped showing in the cart or a discount code that spread further than planned. A sudden jump is worth checking too, since a single large order can lift a whole week.
- Monthly review: Compare the full month with the previous month and with the same month last year. A monthly view smooths out the ups and downs of single weeks and shows whether your AOV is actually moving in the right direction.
- After every change: Each time you launch a bundle, change the free shipping threshold or add an upsell, write the date down in a simple sheet. Without those dates, telling which change moved AOV and which did nothing becomes guesswork.
- Before and after big sale seasons: Note your AOV in the weeks before Diwali, Black Friday or any big sale, then check it again a few weeks after. Comparing the two shows whether the season brought in customers who keep buying at a higher value or only a short spike.
Conclusion
AOV is not a number to check once and forget. It changes with every price you set, every offer you run and every product you place in front of a customer at the right moment.
Now that you know how to calculate AOV, use the average order value formula on your own numbers for the last three months. Then compare it with your industry and decide which one change you will test first.
If that change is in your cart, UpCartAOV can help. It lets you show related products on your product pages and inside the cart drawer, add a free shipping progress bar with up to three reward tiers, and give a free gift once a customer crosses a set amount. Each block can be turned on separately, so you can test one idea at a time and see what actually moves your Shopify AOV.
See What UpCartAOV Can Add to Your Cart
Frequently Asked Questions (FAQs)
Question: How do I calculate AOV on Shopify?
Answer: Divide your total revenue by the number of orders for the same period. Shopify also shows this automatically on the Analytics dashboard under the Average order value card.
Question: What is a good AOV for a new Shopify store?
Answer: There is no single right number. Compare yourself with brands at a similar price point in your industry, and focus on growing your own AOV month over month.
Question: Should AOV include shipping and taxes?
Answer: No. Shipping and taxes are not product revenue, so leaving them out gives you a cleaner picture of what customers spend on your products.
Question: Does a higher AOV always mean more profit?
Answer: Not always. If you raise AOV by giving large discounts, your margin per order may shrink. Always check your profit along with your AOV.
Question: What is the fastest way to raise AOV?
Answer: For most Shopify brands, relevant upsells in the cart drawer and a free shipping threshold set just above your current AOV are the quickest changes to test.

